How to check unit prices
We use unit prices to value your investment in GESB Super, West State Super, RI Allocated Pension, Transition to Retirement Pension and RI Term Allocated Pension. You can search for unit prices dating back to 1 July 2001 or when your investment plan was introduced.
If you’re talking to an adviser, these unit prices may help inform your decisions.
Action summary
- Time it takes
A quick search of the last three months only takes a couple of minutes - What to consider
You can also do a more detailed search of a custom period or download a csv file - Result
You’ll have a good understanding of how market movements have affected your unit price over time
What you’ll need
- It’s probably easiest to view unit prices using your desktop computer or tablet
Need help
- Call us on 13 43 72 if you have any questions
1. Find the unit price tables
First, click this link to visit the unit price page. This page shows the GESB Super Readymade plans unit price table for the past three months. If you want to see the unit prices for one of our other accounts, click the tab for the type of account you would like to view.
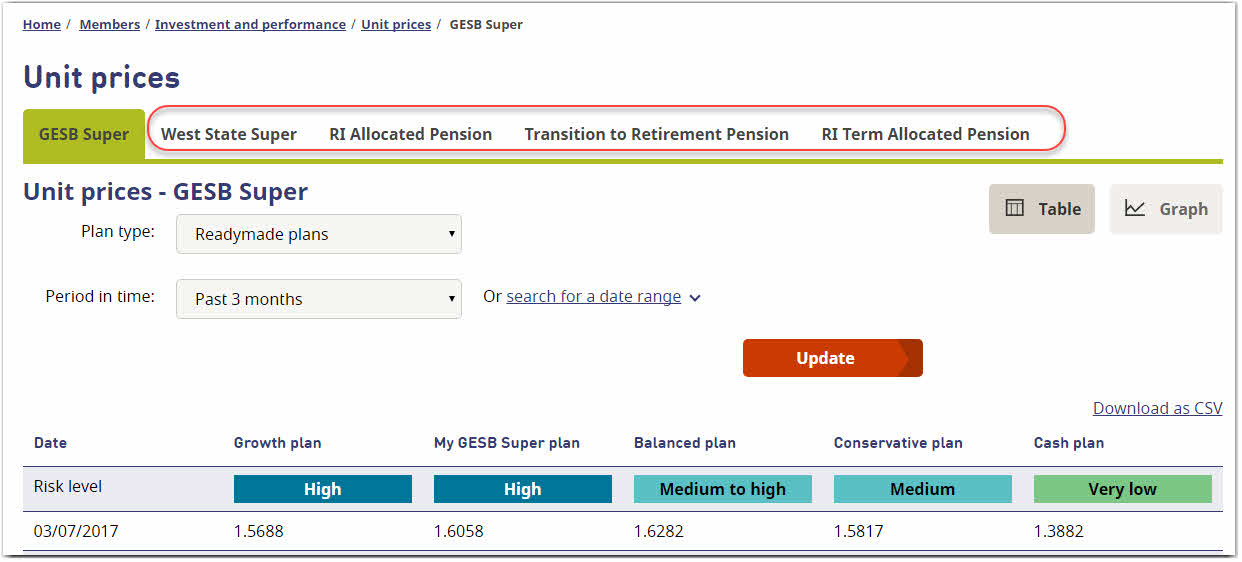
In the first view you will see the Readymade plans side by side so you can easily compare the unit prices for each plan. We also show you the risk level for each. Below that the unit price is listed for each date that you’ve searched for.
Search for Mix Your plan options
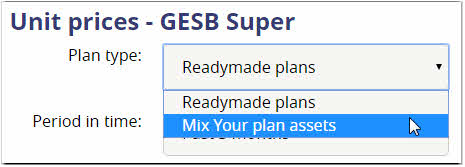
If you are interested in seeing the Mix Your plan unit prices instead, then use the ‘plan type’ dropdown menu towards the top of the page to change your selection from Readymade to Mix Your plan.
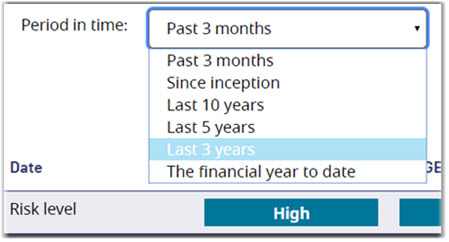
You can also use the ‘period in time’ dropdown menu to choose from a number of predefined periods if you want to search for more than three months’ worth of unit prices.
If you want to search for a more specific period, you need to use the ‘or search for a date range’ option. When you click that option, date fields appear so you can enter the dates you would like to search for.
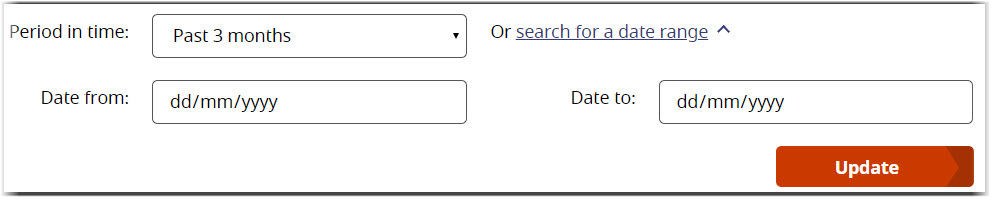
Once you’ve made your selection, simply click the ‘update’ button to refresh the results.
Once the table shows you the dates you have been searching for, you can also choose to download these unit prices in a csv format.
That will allow you to use your device’s software to work with the information.
2. See unit price movements as a graph
If you would like an overview of how the unit prices have changed over time, you can click on the graph icon to change from the table to the graph view.

It will show you the lines for the top two plans. To the right of the graph, you can tick as many options as you want to show in the graph. Or, you can untick any plans you don’t want to see on the graph.
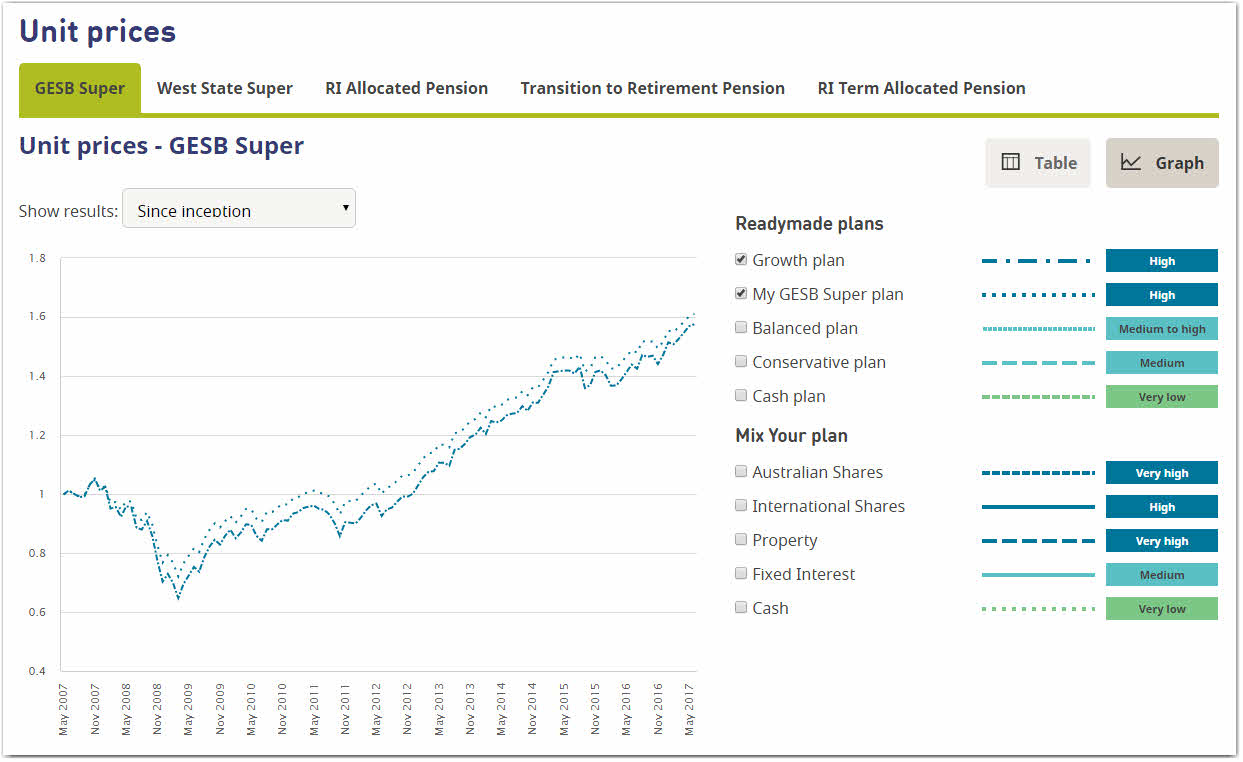
The graph shows from inception (the beginning of that plan’s history) but you can use the dropdown menu to search for shorter periods.
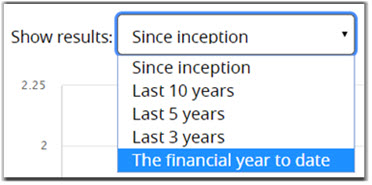
Simply click the option you want to refresh your screen.
When you select ‘financial year to date’, the graph includes the unit prices for each date. You can hover your mouse over the lines to see what the unit price was for each day.
For any period longer than the current financial year, the graph displays the last unit price for each month to show how the unit price has changed over time.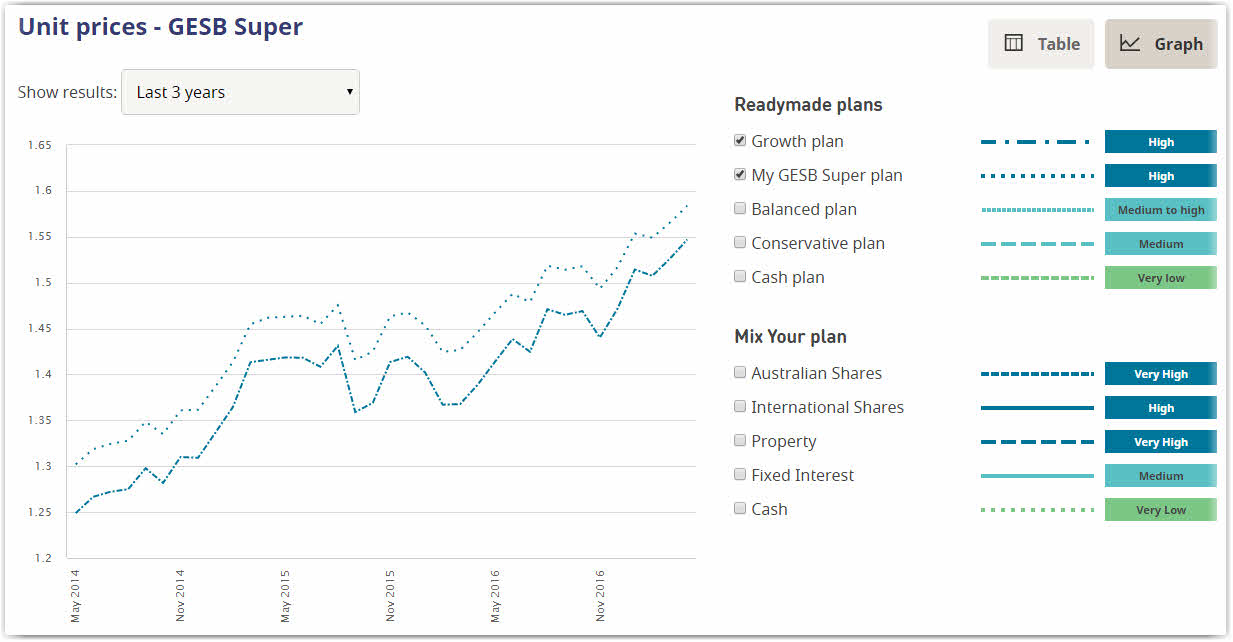
3. Read the footnotes
The footnotes below explain important information about forward unit pricing and how it applies to transactions.
We typically use a 'forward unit pricing' system, which is a widely adopted standard in the funds management and superannuation industry, and allows us to treat all members fairly. Find out more about unit prices.
- When processing contributions or withdrawals, the price used will be calculated after the contribution or withdrawal request is received
- Unit prices are generally posted on the second business day following the transaction being processed
- Since 11 November 2004, GESB has calculated unit prices on a daily basis. Prior to this, unit prices were calculated on a weekly basis
- The unit prices shown for Fixed Interest for the period prior to 1 May 2008, relate to the Australian Fixed Interest asset class (which is now closed)
- Past performance is not a reliable indicator of future performance
Thank you for printing this page. Remember to come back to gesb.wa.gov.au for the latest information as our content is updated regularly. This information is correct as at 19 April 2024.