Investment update – June 2020 quarter
Key highlights
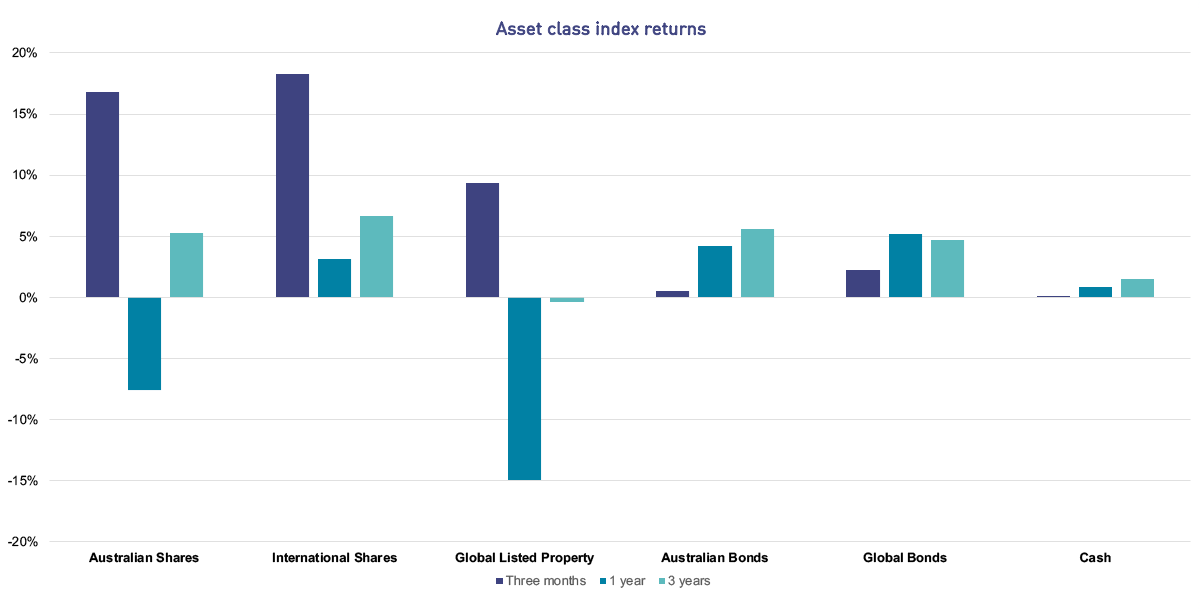
- Over the June quarter, international share markets gained an average of 18%, excluding the impact of currency movements. The Australian share market also performed strongly and was up 17%. The easing of lockdown restrictions and progress on developing a COVID-19 coronavirus vaccine contributed to the positive sentiment in financial markets
- Over the past year, International Shares returned 3% on average, while Australian Shares returned -8%
- My GESB Super returned 7.26% for the quarter compared to -12.05% the previous quarter
- My West State Super returned 7.22% for the quarter compared to -11.65% the previous quarter
- RI Allocated Pension Conservative plan returned 4.28% in the June quarter, versus -5.96% for the previous quarter
Investment market returns: short and medium term
Australian and International Shares delivered positive returns for the June quarter as a result of revived risk sentiments to financial markets. Listed property markets also achieved positive returns, though not as strong as broader share markets. Returns from the lower risk asset classes of Cash and Bonds were positive, but not as high as Shares and Property.

Source:
Australian Shares - S&P/ASX Total Return 300 Index; International Shares - MSCI ACWI Net Total Return Local Index; Global Listed Property - FTSE Custom EPRA/NAREIT Global Index Values Local TRI; Australian Bonds - Bloomberg AusBond Composite 0+ Yr Index; Global Bonds - Bloomberg Barclays Global-Aggregate Total Return Index Value Hedged AUD; Cash - Bloomberg AusBond Bank Bill Index
What were the main reasons for recent investment market returns?
- Easing of lockdown restrictions and potential vaccines in development
Positive developments globally helped share markets end the second quarter higher. Consumer spending rebounded and investors became more optimistic on the development of a COVID-19 vaccine. The US share market was up 20%, European share markets were up 17% and the Australian share market was up 17%. - Continued central bank stimulus helped recovery in many countries
Central banks in most developed countries have low to near-zero official interest rates and are willing to keep their interest rates low for the foreseeable future. The US Federal Reserve maintained its official cash rate at 0% to 0.25% while the Reserve Bank of Australia left its official cash rate at 0.25%.
Stimulus packages were announced by most major central banks, led by US Federal Reserve’s $1 trillion lending programme in May. The European Commission proposed a 750-billion-euro recovery package, which was in addition to its 540-billion-euro rescue package in April. The extra money has driven down yields on government bonds, making other assets, such as Shares, more attractive. - Technology stocks rally
Information technology stocks have benefitted greatly from more people working from home and shopping online. The stock price increases were concentrated in some popular index leaders that have dominated performance in recent years. Due to their high earnings potential and lower debt levels, these stocks were preferred by investors as a defence against a potential stock market crash and lower bond yields. In the US, technology stocks were up 30% for the quarter, and up 44% for the quarter in Australia.
Investment market returns: long term
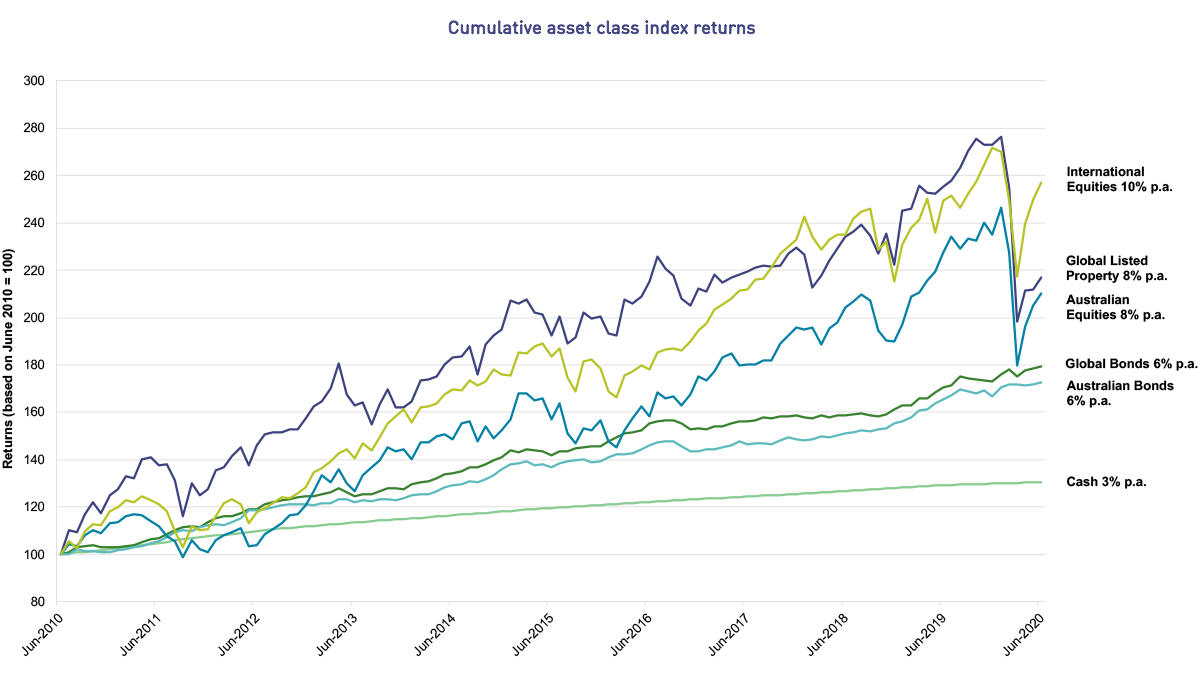
Over the longer term (10 years), investments such as Shares and Property have produced the highest returns (but with greater variability), while Cash has produced the lowest (but most stable) returns. This is illustrated in the chart below.

Source:
Cash - Bloomberg AusBond Bank Bill Index; Global Bonds - Bloomberg Barclays Global-Aggregate Total Return Index Value Hedged AUD; Australian Bonds - Bloomberg AusBond Composite 0+ Yr Index; Global Listed Property - FTSE Custom EPRA/NAREIT Global Index Values Local TRI; Australian Shares - S&P/ASX Total Return 300 Index; International Shares - MSCI ACWI Net Total Return Local Index
What does this mean for your investment?
The investment returns over both short and long terms for some of our diversified plans are illustrated in the table below. You can also see the investment return history for all of our available plans.
Performance of investment options
| June 2020 quarter | 1 year | 3 years (p.a.) | 5 years (p.a.) | 10 years (p.a.) | |
|---|---|---|---|---|---|
| RI Allocated Pension Conservative plan1 | 4.28% | 0.52% | 3.86% | 4.11% | 5.69% |
| Transition to Retirement Pension Balanced plan2 | 6.74% | -1.17% | 4.41% | - | - |
| My West State Super3 | 7.22% | -1.10% | 4.86% | 5.18% | 7.71% |
| My GESB Super1 | 7.26% | -1.59% | 4.52% | 4.87% | 7.25% |
| RI Allocated Pension Balanced plan1 | 7.82% | -1.46% | 4.88% | 5.33% | 7.67% |
| RI Term Allocated Pension Balanced plan1 | 7.85% | -1.42% | 4.90% | 5.35% | 7.50% |
| West State Super Growth plan3 | 8.13% | -2.19% | 4.87% | 5.37% | 8.16% |
| Other investment plans | See the investment returns for all of our available plans | ||||
Returns greater than one year are annualised.
The performance over the quarter has been helped by both the strong market performance and our above index returns across Australian Shares, Bonds and Infrastructure asset classes. Our diversified plans have performed well over 5 and 10 years, and returns are ahead of primary investment objectives.
While long-term performance has been strong, we are by no means complacent. We are focused on delivering long-term returns that meet or exceed objectives, while remaining flexible to manage evolving investment market conditions. We follow a process to ensure well-credentialed investment managers are appointed and our portfolio is positioned in a manner consistent with our investment objectives.
1 Returns are reported net of fees and taxes.
2 Transition to Retirement Pension was incepted on 15 June 2017, so longer term returns are not available. Returns are reported net of fees and taxes.
3 Returns are reported net of fees.
Performance information should be used as a guide only, is of a general nature, and does not constitute legal, taxation, or personal financial advice. The performance of your investment plan is not guaranteed and returns may move up or down depending on market conditions. Past performance should not be relied on as an indication of future performance. In providing this information, we have not taken into account your objectives, financial situation or needs. You should consider whether the information is appropriate to your objectives, financial situation, or needs before acting on it. You should consider seeking appropriate independent professional advice from a qualified advisor before making any decision with respect to your investment plan or your account. We are not licensed to provide financial product advice. You should read this information in conjunction with other relevant disclosure documents we have prepared and where necessary seek advice specific to your personal circumstances from a qualified financial adviser.
More information
- Find out more about investing with us
- See our super investment options or retirement investment options
- Read our tips for investing during a market downturn
- Download a PDF printable copy of our Investment update - June 2020 quarter
Need help
- Investment FAQ's
- Find a personal financial adviser
- Call us on 13 43 72
Thank you for printing this page. Remember to come back to gesb.wa.gov.au for the latest information as our content is updated regularly. This information is correct as at 20 April 2024.