Investment update – June 2019 quarter
Key highlights
- Share and Bond markets performed well over the past three months, helped by expectations that interest rates would continue to fall and support economic growth
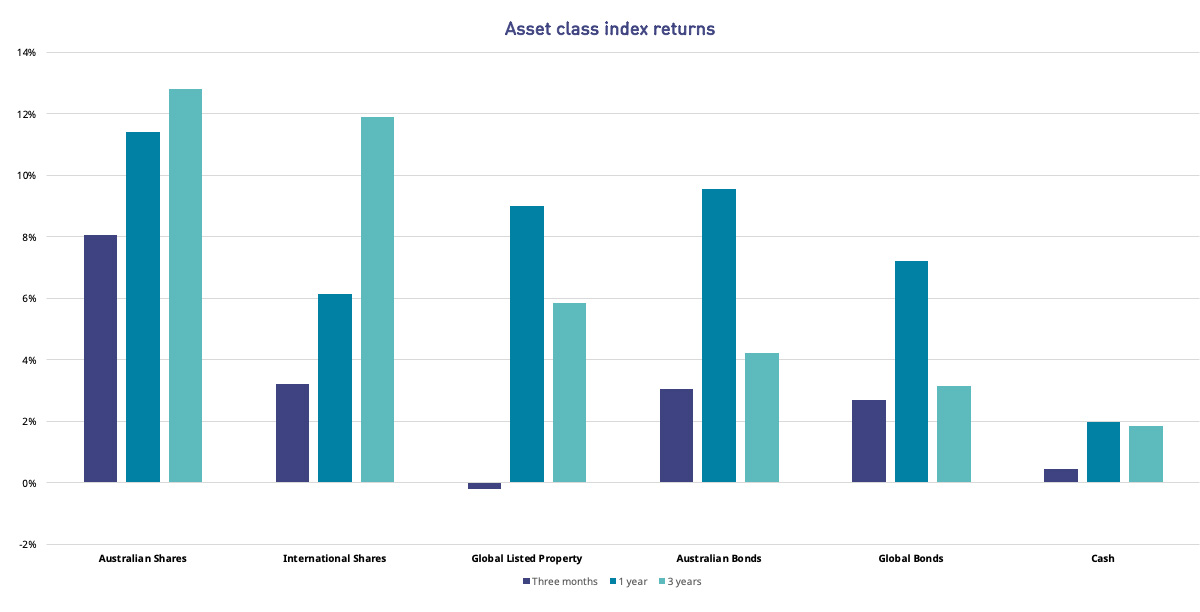
The performance of these markets was also strong over the past 12 months. - Australian Shares was the best performing major asset class, returning 8.05% over the past three months, which lifted the 12-month return to 11.42%
These positive returns were supported by the surprise May Federal election result and June interest rate cut by the Reserve Bank of Australia. - International Shares returned 3.23% over the past three months and 6.1% over the year
- Despite the strong returns, ongoing US-China trade talks have weighed on share markets over the past 12 months
- Interest rate cuts (and expectations of further cuts) helped drive Bond markets higher
- Over the past three months, Bond markets were up around 3% for the June quarter and over 7% for the year
- My GESB Super returned 3.60% for the quarter and 7.18% for the year
- My West State Super returned 3.55% for the quarter and 7.79% for the year
- RI Allocated Pension Conservative plan returned 2.34% for the quarter and 5.89% for the year
Investment market returns: short and medium term
The performance of major asset classes over the three months, year and three years to 30 June 2019 is shown below.

What were the main reasons for recent investment market returns?
- Expectations of interest rate cuts helped support share market returns ...Optimism returned to share markets in June as the United States Federal Reserve Bank hinted it may cut interest rates in 2019 to help preserve US economic growth. This sentiment was shared by a number of central banks globally and helped International Equities return 3.23% for the quarter and 6.14% for the year.
- …but US-China trade talks continue to weigh on markets
Despite overall returns being good, shares experienced significant falls from time to time as ongoing US-China trade talks broke down. Investors became increasingly worried that trade tariffs could lead to a global economic slowdown. - The Australian share market was the standout performer
The surprise May Federal election result and June interest rate cut by the Reserve Bank of Australia (RBA) supported an 8.05% rally in Australian Shares over the quarter. Bank stocks led the gains as the previous concerns around Labor’s policies to limit negative gearing, impose higher bank levies and place tougher restrictions on mortgage brokers faded. Rising commodity prices, particularly iron ore, also supported share prices. - Bond markets also benefited from lower interest rate expectations Global Bonds added 2.68% for the quarter as investors anticipated that a number of major central banks would cut interest rates. This lifted the one year performance to 7.23%.
After raising interest rates in March, June and September 2018, the US Federal Reserve kept rates on hold at its June meeting. However, they indicated there may be cuts ahead as economic data continues to be mixed. While US economic growth and employment conditions are encouraging, consumer and business confidence is softening.
Meanwhile, the European Central Bank hinted that further monetary policy easing could be on the way if the eurozone inflation outlook fails to improve. Annual inflation in the region is currently 1.2%. - Australian Bonds rallied
Australian Bonds returned 3.05% over the quarter and 9.57% over the year and outperformed offshore bonds.
The RBA cut the official cash rate from 1.50% to 1.25% in June – the first cut since August 2016. A slowing domestic economy, early signs of rising unemployment and low inflation were the key reasons for the RBA to cut rates.
Investment market returns: long term
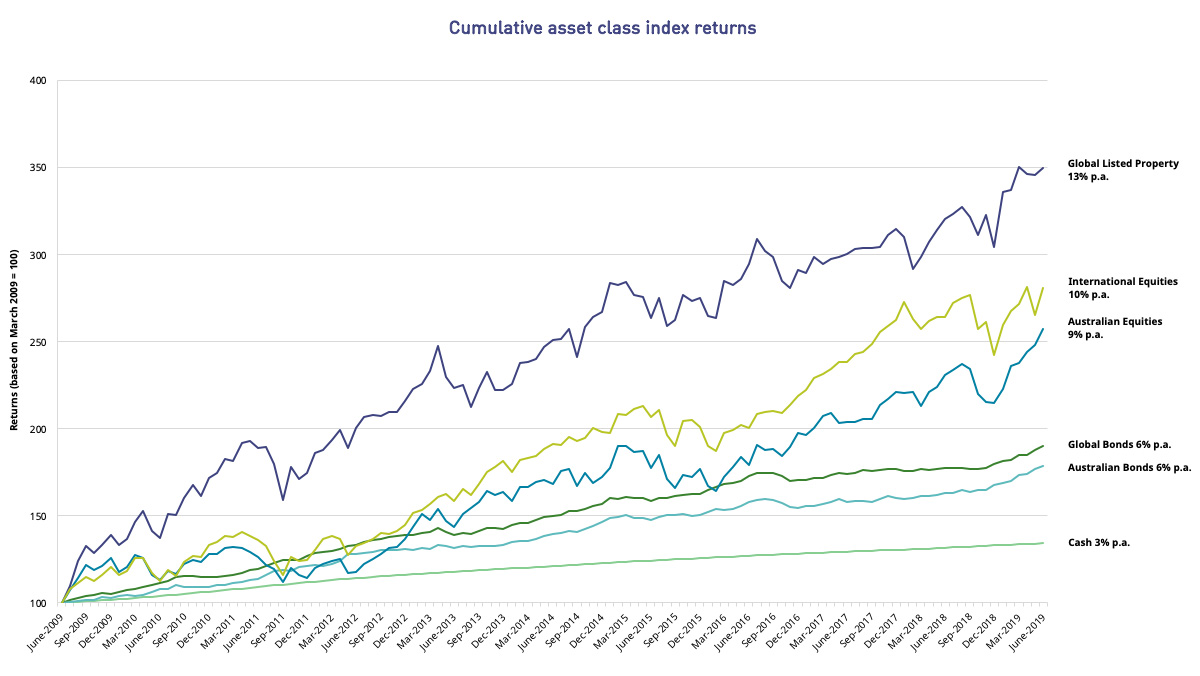
Over the longer term (10 years), Shares and Property have produced the highest returns (but with greater variability), while Cash and Bonds have produced lower (but more stable) returns. This is illustrated in the chart below.

What does this mean for your investment?
The strong investment returns over both the short and long term has helped our returns over the past 10 years. The table below sets out the performance of some of our investment plans.
Performance of investment options
| June 2019 quarter | 1 year | 3 years | 5 years | 10 years | |
|---|---|---|---|---|---|
| RI Allocated Pension Conservative plan1 | 2.34% | 5.89% | 5.28% | 5.06% | 6.52% |
| Transition to Retirement Balanced plan2 | 3.38% | 7.02% | - | - | - |
| My GESB Super1 | 3.60% | 7.18% | 8.06% | 7.14% | 8.65% |
| RI Term Allocated Pension Balanced plan1 | 3.68% | 7.58% | 8.06% | 7.14% | 8.65% |
| My West State Super3 | 3.55% | 7.79% | 8.32% | 7.32% | 9.10% |
| RI Allocated Pension Balanced plan1 | 3.71% | 7.85% | 8.26% | 7.31% | 9.03% |
| West State Super Growth plan3 | 3.84% | 7.74% | 9.14% | 8.00% | 9.69% |
| Other investment plans | See the investment returns for all of our available plans | ||||
Returns greater than one year are annualised.
Our diversified plans have performed well over the past one, three, five and 10 years, and returns are ahead of primary investment objectives. This performance has been helped by both the strong market performance and our above index returns across Cash, Bonds, Infrastructure and International Shares over the past year.
While short and long-term performance has been strong, we are by no means complacent. We are focused on delivering long-term returns that meet or exceed objectives, while remaining flexible to manage evolving investment market conditions. We follow a careful process to ensure our investment managers are making prudent decisions and achieving returns consistent with our investment objectives.
1 Returns are reported net of fees and taxes.
2 Transition to Retirement Pension was incepted on 15 June 2017, so longer term returns are not available. Returns are reported net of fees and taxes.
3 Returns are reported net of fees.
Performance information should be used as a guide only, is of a general nature, and does not constitute legal, taxation, or personal financial advice. The performance of your investment plan is not guaranteed and returns may move up or down depending on market conditions. Past performance should not be relied on as an indication of future performance. In providing this information, we have not taken into account your objectives, financial situation or needs. Therefore, you should consider the appropriateness of the information in relation to your objectives, financial situation or needs, before acting on it. We are not licensed to provide financial product advice. You should read this information in conjunction with other relevant disclosure documents we have prepared. You should seek advice specific to your personal circumstances from a qualified financial adviser before making any decision with respect to your investment plan.
More information
- Find out more about investing with us
- See your super investment options or retirement investment options
- Read our tips for investing during a market downturn
- Download a PDF printable copy of our Investment update - June 2019 quarter
Need help
- Investment FAQ's
- Find a personal financial adviser
- Call us on 13 43 72
Thank you for printing this page. Remember to come back to gesb.wa.gov.au for the latest information as our content is updated regularly. This information is correct as at 20 April 2024.