Investment update – September 2020 quarter
Key highlights
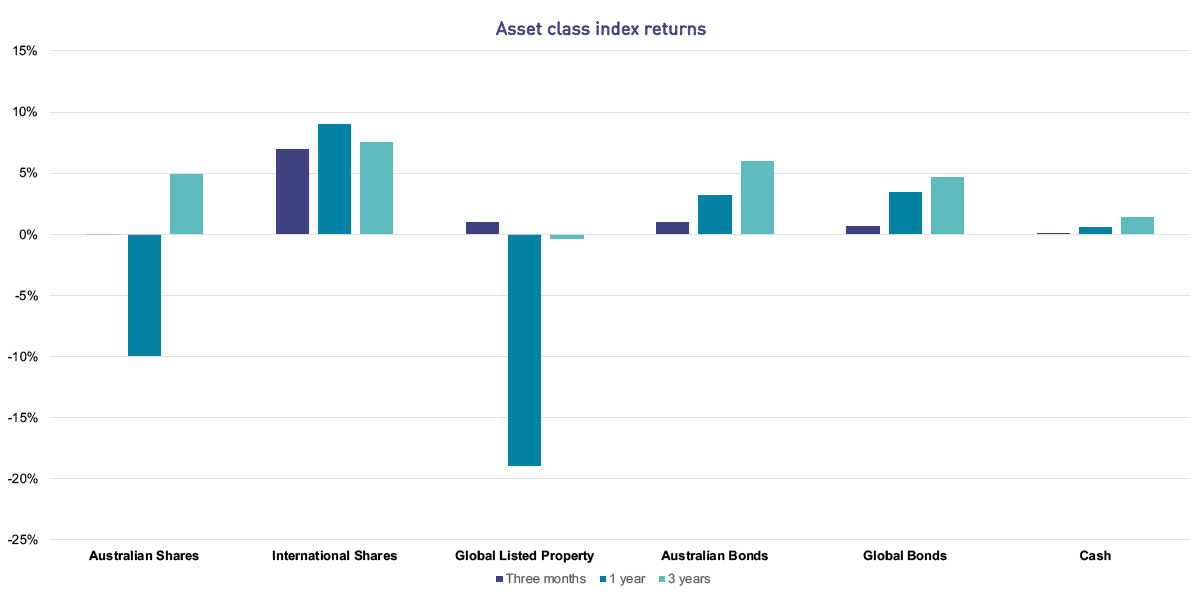
- Over the September quarter, International Shares gained 6.94%, excluding the impact of currency movements. Despite mixed economic data, progress on developing a COVID-19 coronavirus vaccine contributed to the positive sentiment in financial markets. However, Australian Shares were broadly flat, returning -0.06% over the quarter
- Over the past year, International Shares were up by around 9%, benefiting from the strong performance of information technology and healthcare stocks in the US, while Australian Shares were down by almost 10%
- My GESB Super returned 1.12% for the quarter
- My West State Super returned 1.72% for the quarter
- RI Allocated Pension Conservative plan returned 1.03% for the quarter
Investment market returns: short and medium term
International Shares was the only major asset class to generate a meaningful return over the quarter led by the US share market. Other major asset classes were relatively flat. Over the three-year period, shares and bonds have delivered returns in the range of 4% to 8% per annum – a reasonable outcome given the market volatility experienced earlier in the year.

Source:
Australian Shares - S&P/ASX Total Return 300 Index; International Shares - MSCI ACWI Net Total Return Local Index; Global Listed Property - FTSE Custom EPRA/NAREIT Global Index Values Local TRI; Australian Bonds - Bloomberg AusBond Composite 0+ Yr Index; Global Bonds - Bloomberg Barclays Global-Aggregate Total Return Index Value Hedged AUD; Cash - Bloomberg AusBond Bank Bill Index
What were the main reasons for recent investment market returns?
- Mixed economic data globally
Employment numbers in the US and Australia are improving but remain weak in Europe and the UK. In the US, manufacturing and confidence numbers showed signs of improvement on the back of strengthening consumer demand. The Australian economy continues to face challenges with GDP falling 7% over the three months to 30 June 2020 (the largest quarterly fall on record) while consumer spending was down 13%. - Central banks continuing highly accommodative stance
The US Federal Reserve continued its highly accommodative policy stance and agreed to ‘average inflation targeting’ where inflation will be allowed to rise above 2% p.a. to compensate for prior periods where inflation was below 2% p.a. The objective is to mitigate the risk of lower inflation and inflation expectations.
The Reserve Bank of Australia kept the official cash rate at 0.25% at its September meeting and announced an increase and extension of its Term Funding Facility (TFF), providing up to $200 billion of capital for banks. The TFF will provide banks with additional funding at a fixed rate of 0.25% p.a. for three years. - Fiscal support from governments continue
The US Government has spent USD$3 trillion and is expected to add up to another USD$3.5 trillion to support its domestic businesses and households. European governments have a combined budget deficit close to 1 trillion-euro, ten times higher than last year’s levels. In Australia, government debt is estimated to peak at almost $1 trillion by 2024 to support business recovery and jobs growth.
On the back of continued government policy support, International Shares rallied in the September quarter, led by US information technology and healthcare stocks.
Investment market returns: long term
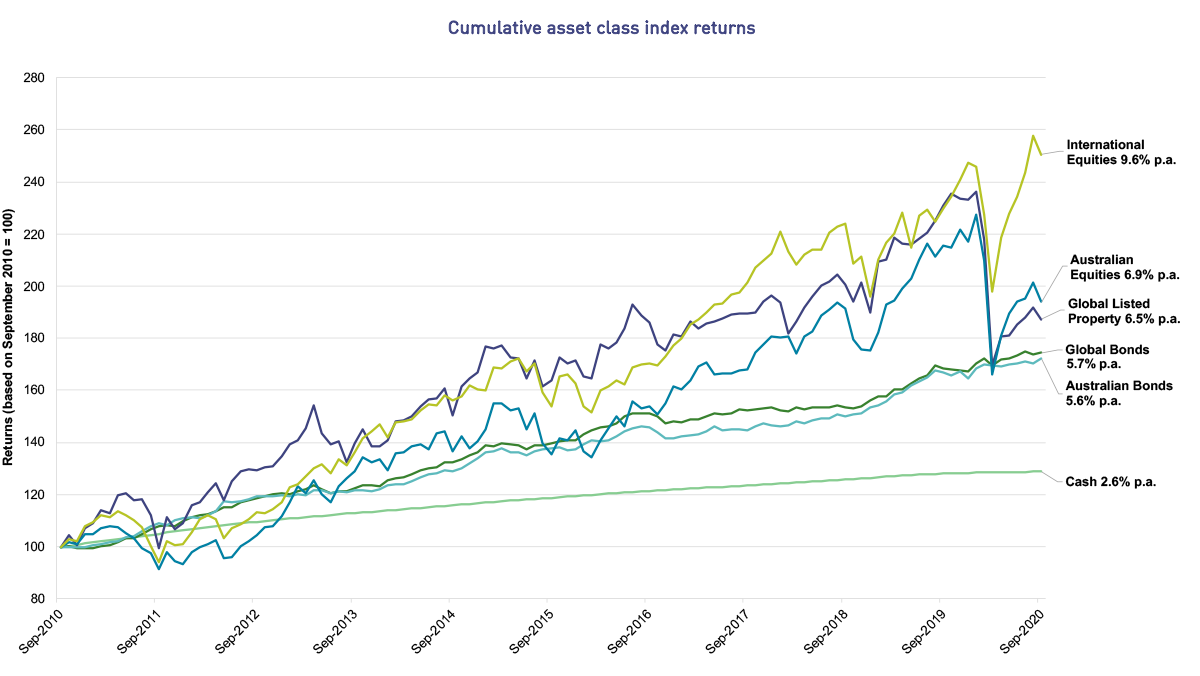
Over the longer term (10 years), investments such as Shares and Property have produced the highest returns (but with greater variability), while Cash has produced the lowest (but most stable) returns. This is illustrated in the chart below.

Source:
Cash - Bloomberg AusBond Bank Bill Index; Global Bonds - Bloomberg Barclays Global-Aggregate Total Return Index Value Hedged AUD; Australian Bonds - Bloomberg AusBond Composite 0+ Yr Index; Global Listed Property - FTSE Custom EPRA/NAREIT Global Index Values Local TRI; Australian Shares - S&P/ASX Total Return 300 Index; International Shares - MSCI ACWI Net Total Return Local Index
What does this mean for your investment?
Investment returns over both the short and long term for some of our diversified plans are illustrated in the table below. You can also see the investment return history for all of our available plans.
Performance of investment options
| September 2020 quarter | 1 year | 3 years (p.a.) | 5 years (p.a.) | 10 years (p.a.) | |
|---|---|---|---|---|---|
| RI Allocated Pension Conservative plan1 | 1.03% | 0.02% | 3.83% | 4.34% | 5.46% |
| Transition to Retirement Pension Balanced plan2 | 0.97% | -2.10% | 4.18% | - | - |
| My West State Super3 | 1.72% | -1.41% | 4.78% | 5.87% | 7.41% |
| My GESB Super1 | 1.12% | -2.53% | 4.30% | 5.44% | 6.88% |
| RI Allocated Pension Balanced plan1 | 1.43% | -2.15% | 4.74% | 5.95% | 7.33% |
| RI Term Allocated Pension Balanced plan1 | 1.42% | -2.12% | 4.76% | 5.97% | 7.16% |
| West State Super Growth plan3 | 1.89% | -2.45% | 4.77% | 6.20% | 7.82% |
| Other investment plans | See the investment returns for all of our available plans | ||||
Returns greater than one year are annualised.
Performance over the quarter has been helped by the performance from International Shares and above index returns from Medium Risk Alternatives and Infrastructure. Our diversified plans have performed well over 5 and 10 years, and returns are ahead of primary investment objectives.
While long-term performance has been strong, we are by no means complacent. We are focused on delivering long-term returns that meet or exceed objectives, while remaining flexible to manage evolving investment market conditions. We follow a process to ensure well-credentialed investment managers are appointed and our portfolio is positioned in a manner consistent with our investment objectives.
1 Returns are reported net of fees and taxes.
2 Transition to Retirement Pension was incepted on 15 June 2017, so longer term returns are not available. Returns are reported net of fees and taxes.
3 Returns are reported net of fees.
Performance information should be used as a guide only, is of a general nature, and does not constitute legal, taxation, or personal financial advice. The performance of your investment plan is not guaranteed, and returns may move up or down depending on market conditions. Past performance should not be relied on as an indication of future performance. In providing this information, we have not considered your personal circumstances including your objectives, financial situation or needs. We are not licensed to provide financial product advice. Before acting or relying on any of the information in this website, you should review your personal circumstances and assess whether the information is appropriate for you. You should read this information in conjunction with other relevant disclosure documents we have prepared and where necessary seek advice specific to your personal circumstances from a qualified financial adviser.
More information
- Find out more about investing with us
- See our super investment options or retirement investment options
- Read our tips for investing during a market downturn
- Download a PDF printable copy of our Investment update - September 2020 quarter
Need help
- Investment FAQ's
- Find a personal financial adviser
- Call us on 13 43 72
Thank you for printing this page. Remember to come back to gesb.wa.gov.au for the latest information as our content is updated regularly. This information is correct as at 20 April 2024.