GESB’s climate change action
At GESB, our purpose is to help our members achieve a quality retirement. We know that to fulfil this purpose we need to consider and understand the impact of climate change on investments.
We have made a commitment to achieve net zero carbon emissions in our investment portfolio by 2050. Below we outline how we consider and address climate change risks and the actions we are taking to meet our climate change commitments.
Our plan to transition to net zero will evolve as we continue to build on actions taken, and will take into consideration industry developments, government actions and regulatory guidance, where practical.
Foundations of our climate change plan
Investing responsibly for all our members is a key component of our investment approach. This means making sure that we understand the environmental, social and governance (ESG) factors, including climate change factors, that may impact member outcomes.
Principles and beliefs
Low carbon economy
We believe climate change and the transition to a low carbon economy to be an important ESG factor as it creates financial risks and opportunities for many companies and assets in which we invest.
Best financial interest
We make investment decisions that are in the best financial interest of members. Climate related risks and opportunities are investment risks we consider within our overall risk management strategy.
Prudent management
Prudent management of various risks and opportunities arising from climate change is consistent with our long term investment objectives and forms a part of our investment process.
Zero pathway alignment
To achieve the decarbonisation of our investment portfolio, we acknowledge that our investment managers need to be aligned with our net zero pathway and operate within the principles and requirements outlined in our ESG and Responsible Investment Policy.
As long term investors, it is key to our investment process that we consider the potential impacts of climate change over the short, medium, and long term.
Read our ESG and Responsible Investment Policy for an outline of the environmental risks, including climate change risks, that may impact the financial outcomes of investments.
About our net zero commitment
To achieve this, we recognise the need to identify potential pathways to reduce carbon emissions and ways to measure and monitor our progress.
Our pathway to net zero
We have set interim targets in asset classes where we have identified the carbon emissions profile and where actions can be taken that are consistent with keeping in members’ best financial interests.
Our climate change transition plan does not currently cover our entire investment portfolio. Over time, we intend to gradually include all assets under management.
As our transition plan progresses, we will provide periodic updates to report our progress.
Interim targets
Supporting our overarching goal, we have set interim reduction targets over the medium term, where pathways to achieve such targets have been identified.
To date, we have set the following interim targets:

A 45% reduction in carbon intensity for our listed Shares portfolio by 2030 (using a 2020 baseline)

A net zero target for our
unlisted property portfolio by 2040
These targets are based on scope 1 and scope 2 emissions, as defined by the Greenhouse Gas Protocol.
Collectively, our interim targets represent around 50% of assets under management as at 30 June 2023.
Our climate change actions
Below we outline key actions we’ve taken to manage climate change risk and opportunities as part of our transition plan.
Since establishing our transition plan in 2021, we have achieved the below:
31% carbon intensity reduction in our listed Shares portfolio1
As of 30 June 2023, we’ve achieved a 31% reduction in carbon intensity in our listed Shares portfolio, against our interim target of 45% by 20302.
Our progress to 30 June 2023 has been achieved predominately by adopting low carbon strategies for our passive developed market share portfolio and quantitative style developed market share portfolio.
More specifically:
- In April 2022, BlackRock commenced managing our passive International Shares portfolio with an additional carbon reduction objective
- In June 2023, Vinva started phasing in a carbon reduction constraint into the investment process it applies when managing one of our active International Shares portfolios
These additional carbon reduction objectives mean that, once fully implemented, approximately half of the market value of assets in our International Shares portfolio will be managed with the aim of reducing the carbon intensity of the portfolio by 50% relative to benchmark. This carbon reduction objective sits alongside the financial return objective.
Progress has also been supported by the ongoing decarbonisation efforts of some of the underlying companies in which we invest. Climate change is an engagement priority for many of our investment managers and is undertaken directly and/or through collaborative investor groups. These engagements offer our investment managers an opportunity to further understand a company’s approach to climate risk and its plans to align its business model to a net zero pathway.
The carbon intensity is the amount or volume of carbon emissions per million dollars of sales (in US dollars). It is measured in tonnes of carbon dioxide equivalent (tCO2e). ‘Carbon equivalent’ takes into account other greenhouse gases such as methane, nitrous oxide, etc. based on their global warming potential.
The carbon emissions are determined by measuring the amount of carbon dioxide equivalent (tCO2e) released per million dollars invested.
Both metrics can be used to track changes in the portfolio and compare the portfolio across time.
Net zero goal progress for unlisted property
The reported progress from our investment managers shows the majority of our unlisted property portfolios are on track to achieve our goal of net zero carbon emissions by 2040.
Within our unlisted property portfolio, we have exposure to property assets including retail (such as shopping centres), industrial (such as warehouses and factories) and office properties.
In managing and developing these real estate assets, a number of energy efficient programs which utilise solar, LED lighting and smart metering have been adopted. The use of carbon offsets has also been employed for residual emissions.
Annual scenario analysis
Scenario analysis helps us understand the potential impact climate change may have on our investment returns. Scenarios considered by the Board include different policy action assumptions, future temperature rises, a range of emission pathways and level of physical impacts.
Our latest analysis suggests that:
- If no climate change action is taken, there will be a relatively small impact on medium term investment returns, but a significantly negative impact over the long term
- Conversely, if there are meaningful policy actions to limit climate change, this may hinder investment returns in the short term but with the expectation to improve investment returns in the long term
The outcomes reaffirm the need for action to manage the climate risk and opportunities, but in a very considered way. This supports our current approach to gradually transition the portfolio towards net zero to ensure we continue to act in the best financial interest of members.
We recognise that the majority of high carbon emitters in Australia operate within the fossil fuels industry and that investing in fossil fuels may be a concern for some members.
We monitor our exposure to fossil fuels within our Share portfolios and seek to understand how it contributes to climate change risk.
Our Share portfolios have approximately 12% exposure to fossil fuel producing companies (as at 30 June 2023), including those owning fossil fuel reserves3.
We believe that divesting from all fossil fuels in the short term may not provide desired long term climate change outcomes. Divestment could lead to unintended consequences, such as prolonging the life of high emitting assets by potentially passing the issue on to an investor without net zero commitments, or who is less climate ambitious.
While we take this stance, we do offer members a Sustainable Balanced investment option which applies exclusions as a key part of its investment strategy. For more information, read our Investment choice brochure for details about the GESB Super and West State Super Sustainable Balanced plans, or the Retirement Income Pension Information Booklet for the RI Sustainable Balanced plan.
Monitoring progress
We use external data providers to measure the carbon intensity of our listed Shares portfolio. However, external data is not available for unlisted assets such unlisted property. For this, we rely on the data reported by our external investment managers.
We track and monitor our progress towards our net zero goal through an annual review of our transition plan. Each year, we reassess the appropriateness of our interim targets, report the progress against interim reduction targets and explore additional initiatives, targets and/or action.
Measuring our carbon emissions profile
We use a range of metrics to assess our carbon emissions profile and to measure progress towards our targets at least annually. This involves a detailed internal analysis assisted by industry data.
While there are different ways to measure climate risk, our focus for monitoring and reporting purposes has been on carbon intensity and carbon emissions for listed Shares, which includes both Australian Shares and International Share portfolios.
Our current carbon emissions profile for listed Shares
Carbon metrics as at 30 June 2023
| Australian Shares | ||
|---|---|---|
| Carbon emissions tCO2e per $ million invested | Carbon intensity tCO2e per $ million sales | |
| 31 December 2020 | 186 | 95 |
| 31 December 2021 | 142 | 76 |
| 30 June 2022 | 158 | 77 |
| 30 June 2023 | 157 | 59 |
| International Shares | ||
|---|---|---|
| Carbon emissions tCO2e per $ million invested | Carbon intensity | |
| 31 December 2020 | 317 | 188 |
| 31 December 2021 | 288 | 154 |
| 30 June 2022 | 278 | 150 |
| 30 June 2023 | 255 | 117 |
Progress towards our carbon intensity target
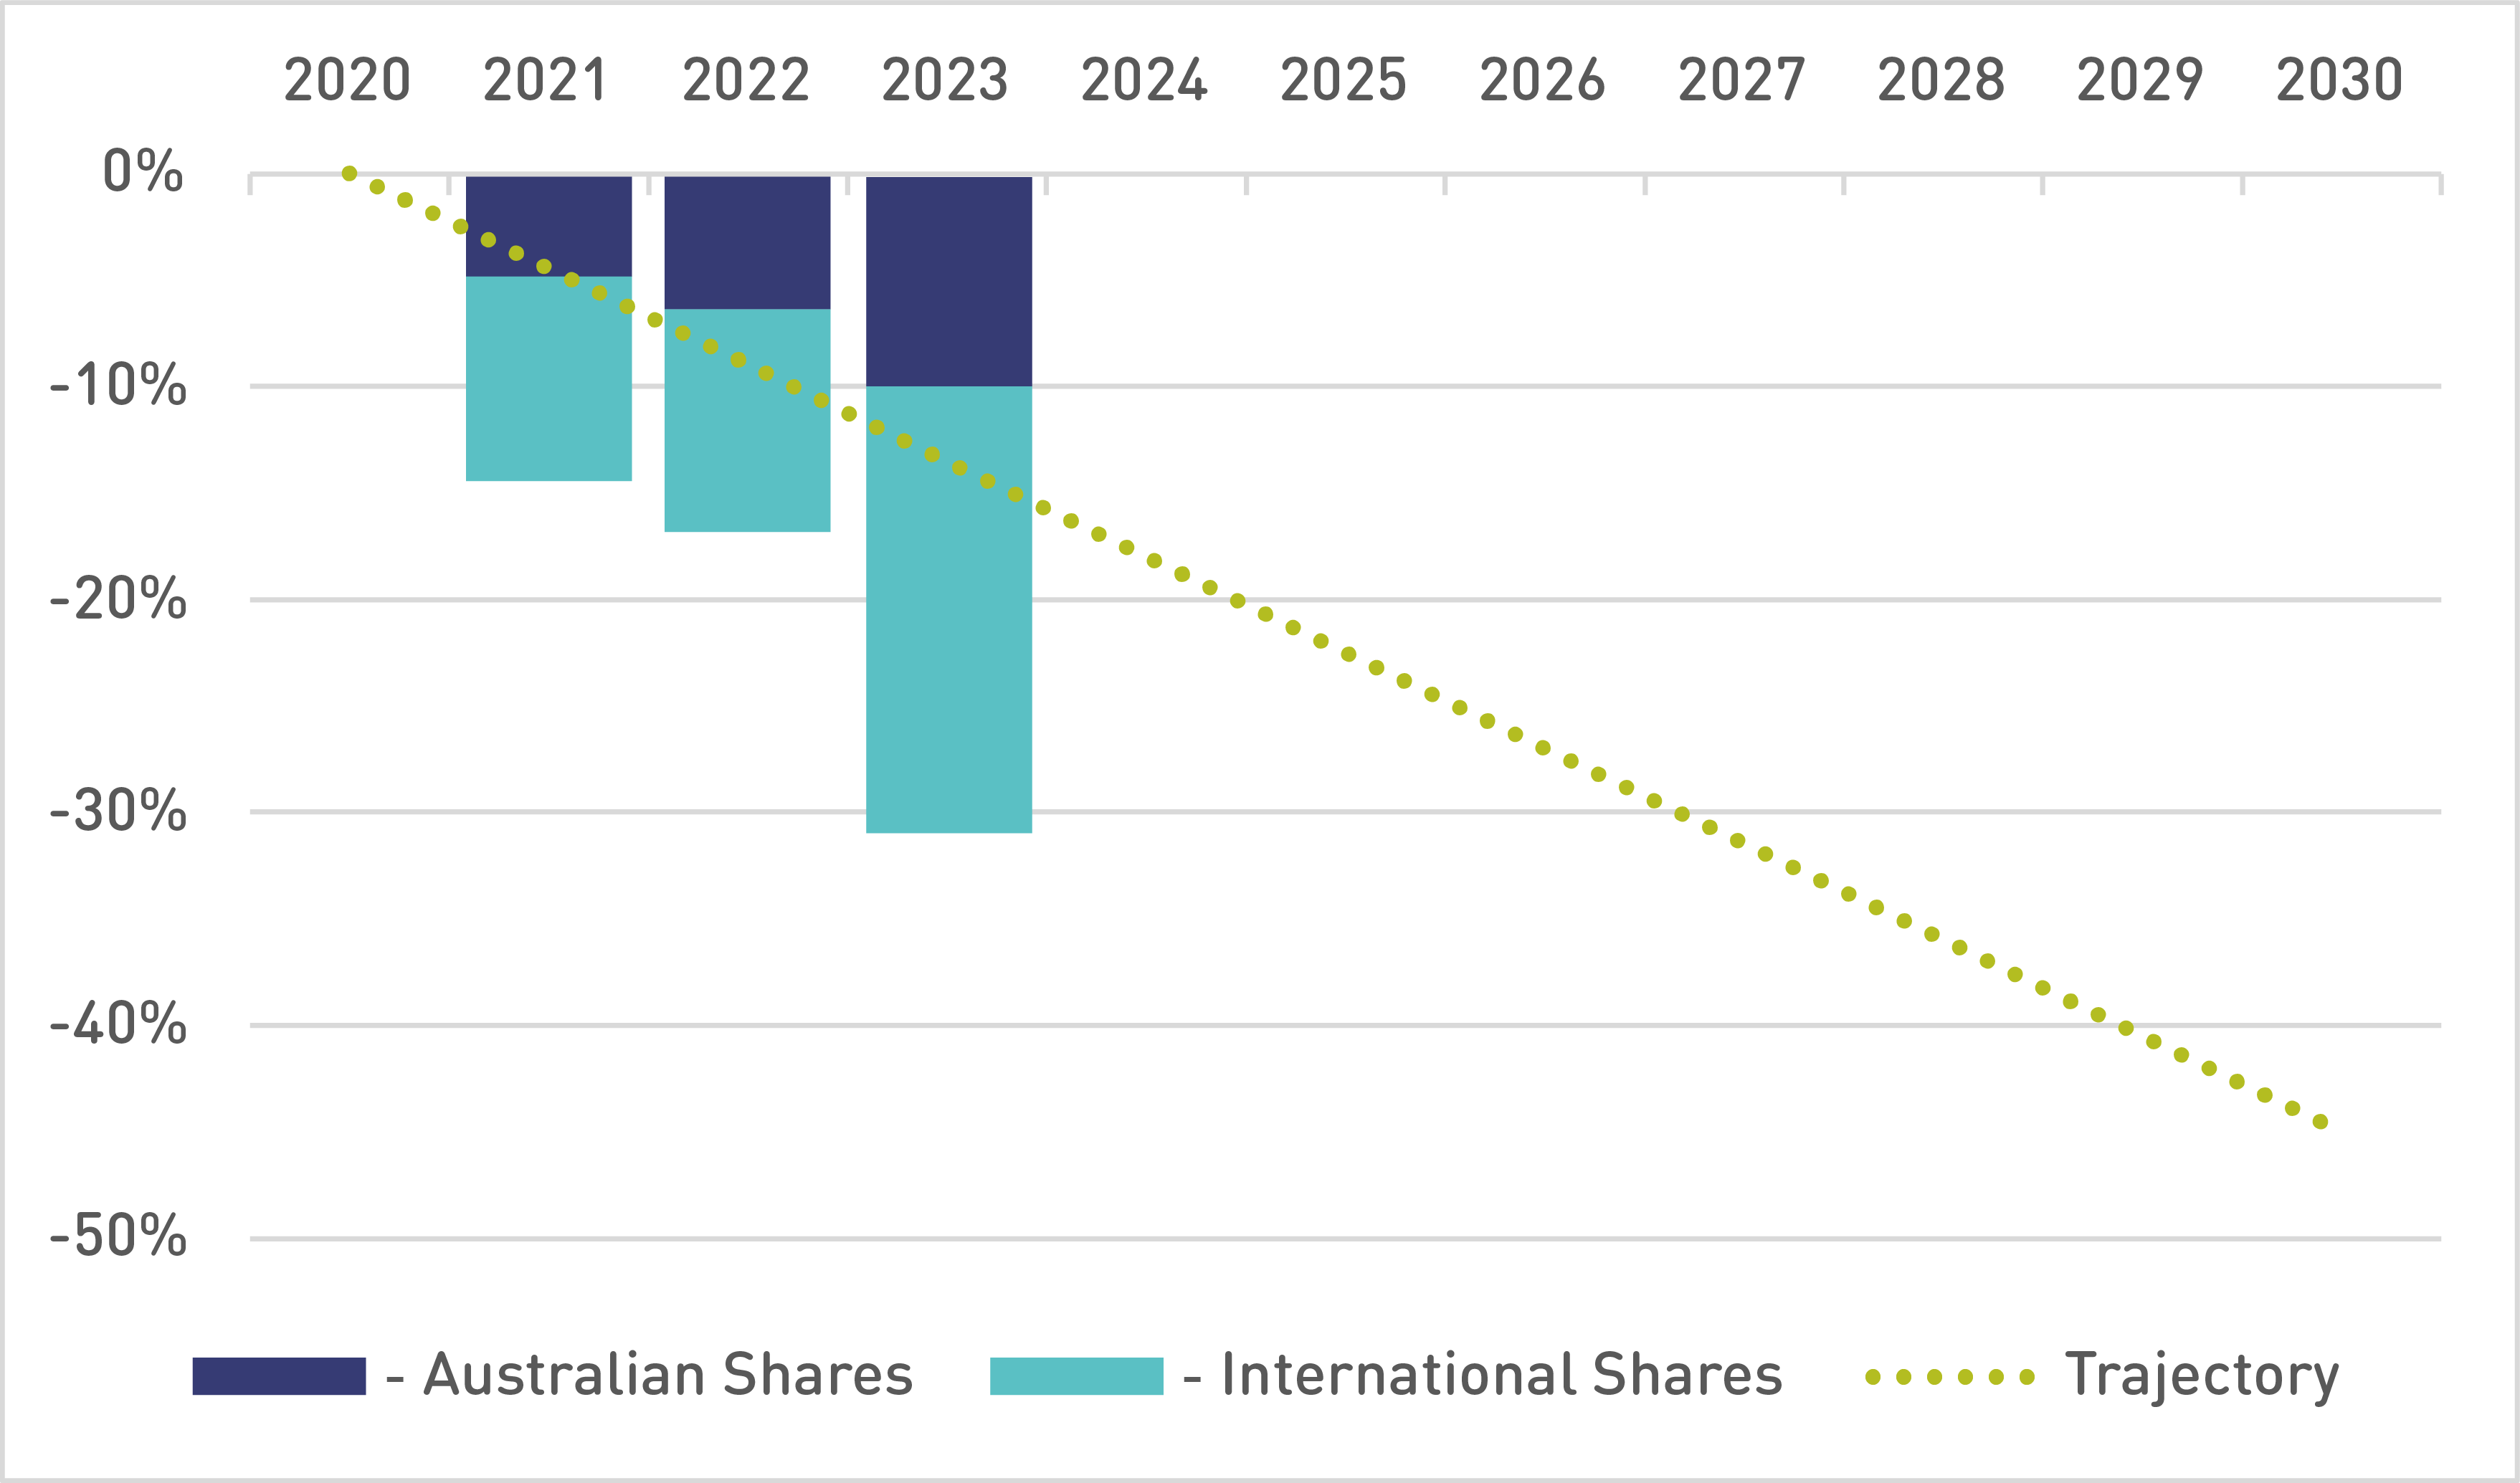
We established a baseline measurement for our listed Shares portfolio in 2020. Since then, we have been measuring and monitoring the carbon intensity of both our Australian Shares and International Shares portfolio on an annual basis.
The graph shows the reduction in carbon intensity for our Australian Shares and International Shares, against a 2020 baseline, to illustrate progress towards our targets to date.
The trajectory indicated in the graph is a visual representation of the pro-rata path required to meet our target of a 45% reduction by 2030. While the graph shows the trajectory as a straight line, the pathway towards net zero is not expected to be linear.
The graph demonstrates we are tracking ahead of our 45% target, with a 31% reduction in Shares achieved to 30 June 2023.
However, the pace of transition will be different for certain sectors and different asset classes. As such, we accept that there may be times where our reported progress is negligible and/or going backwards, despite the actions taken.
Note: until 31 December 2021, the reporting period was based on the calendar year. In 2022, this was aligned to end of financial year reporting4.
Looking ahead
Industry and government will play an important role in our approach to climate change and we will continue to monitor developments as our climate change transition plan progresses.
We recognise there is still plenty of work to do, and we look forward to sharing our progress with our members.

We’re here to help
We understand climate change and environmental, social and governance (ESG) more broadly can be a complex topic.
If you have a specific question about how your super is invested that we haven’t answered yet, please contact us on 13 43 72 or via Live chat. We’d be happy to answer any questions you may have.
More information
- Read our ESG and Responsible Investment Policy
- Read our Proxy voting policy
Need help
- Read our Responsible investing FAQs
- Use Live chat
1 Our 31% reduction in carbon intensity achieved to date utilises the reported emissions sourced from Morgan Stanley Capital International (MSCI) for both Australian and International Share portfolio and is weighted by the portion of assets in Australian and International Shares as at 30 June 2023.
2 In June 2022, our initial 35% reduction target for our listed Shares portfolio by 2030 was revised to a 45% target. This revision took into consideration industry developments and achievements to date.
3 Based on reported data from MSCI for each asset class, weighted by its actual allocation as at 30 June 2023.
4 As our standalone Sustainable Balanced investment option was introduced in 2023, these figures do not include carbon intensity of the Sustainable Balanced plan.
5 This comprises of 18% in Australian Shares and 28% in International Shares.
The information contained in this webpage is of a general nature, and does not constitute legal, taxation or personal financial advice. In providing this information, we have not taken into account your investment objectives, financial situation or needs. We are not licensed to provide financial product advice. Before acting or relying on any of the information in this report, you should read this report in conjunction with the relevant Product Information Booklet and disclosure documents, and consider whether the information is appropriate for you. You may also wish to consult a suitably qualified adviser to assist you.
Thank you for printing this page. Remember to come back to gesb.wa.gov.au for the latest information as our content is updated regularly. This information is correct as at 28 April 2024.