Investment update – 2020/21 financial year
Key highlights
- Most investment markets delivered strong returns, driven by massive government and central bank stimulus
- The mass distribution of COVID-19 vaccines accelerated the recovery of global economies
- International Shares gained 27.5% while Australian Shares added 27.8% as a number of major share markets hit all-time highs
- Bond yields remained low over the year but did increase slightly in early 2021 due to rising inflation expectations
- My GESB Super returned 17.28% for the year
- My West State Super returned 17.34% for the year
- RI Allocated Pension Conservative plan returned 8.16% for the year
Investment market returns: short and medium term
Growth asset classes, which include Australian and International Shares as well as Global Listed Property, delivered strong returns over the quarter and year. Over the past three years, share markets generally delivered returns of around 10% to 15% per annum, whilst bond markets generally delivered returns of around 4% per annum.
Asset class index returns
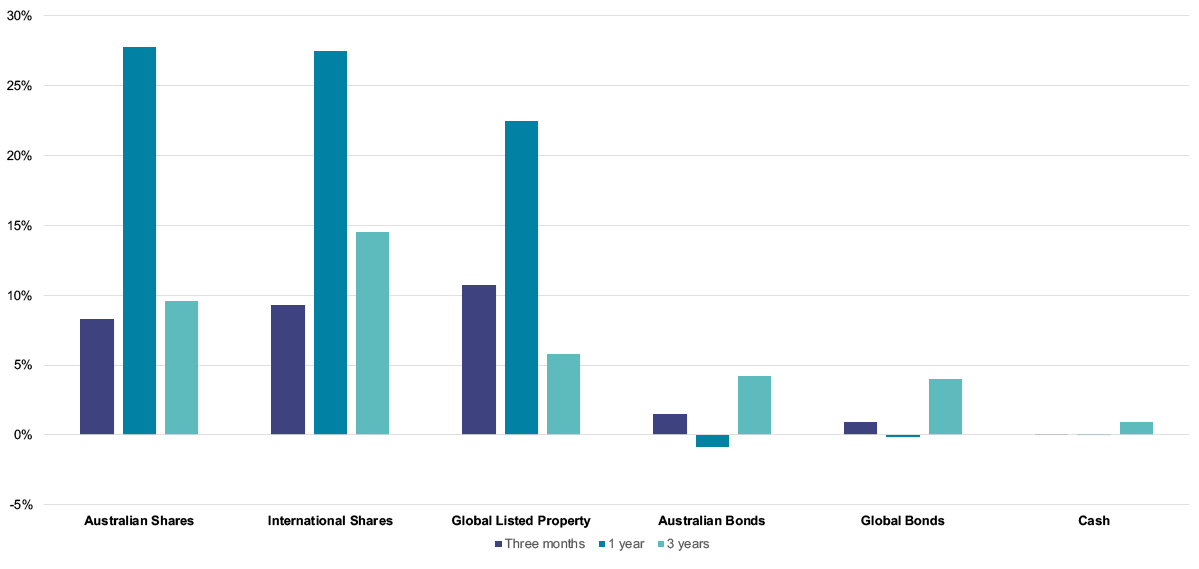
Source: Australian Shares - S&P/ASX Total Return 200 Index; International Shares - MSCI World ex-Australia Net Total Return AUD Index; Global Listed Property - FTSE Custom EPRA/NAREIT Developed Index Net TRI AUD; Australian Bonds - Bloomberg AusBond Composite 0+ Yr Index; Global Bonds - Bloomberg Barclays Global-Aggregate Total Return Index Value Hedged AUD; Cash - Bloomberg AusBond Bank Bill Index
What were the main reasons for recent investment market returns?
- Economic stimulus
Governments and central banks worldwide provided massive economic stimulus in response to the COVID-19 recession. The global response by governments was the largest since World War II, led by the US which spent US$3 trillion and committed another US$3.5 trillion to stimulate its economy. The government response in Australia was AU$291 billion. Central banks around the world cut official cash rates to all-time lows including the Reserve Bank of Australia, which cut the official cash rate to 0.1% per annum. - COVID-19 vaccines
The creation and distribution of vaccines drove the economic recovery. Since the first available vaccine in December 2020, over 1.8 billion people have received at least one dose and 860 million people have been fully vaccinated. - Rising bond yields
An improving growth outlook, along with rising inflation expectations, led to the slight increase in bond yields (meaning bond prices fell). Moderate levels of inflation are consistent with an improving economy but higher than expected levels of inflation may result in interest rates rising sooner than anticipated.
Investment market returns: long term
Over the longer term (10 years), investments such as Shares and Property have produced the highest returns (but with greater variability), while Cash has delivered the lowest (but most stable) returns. This is illustrated in the chart below.
Cumulative asset class index returns
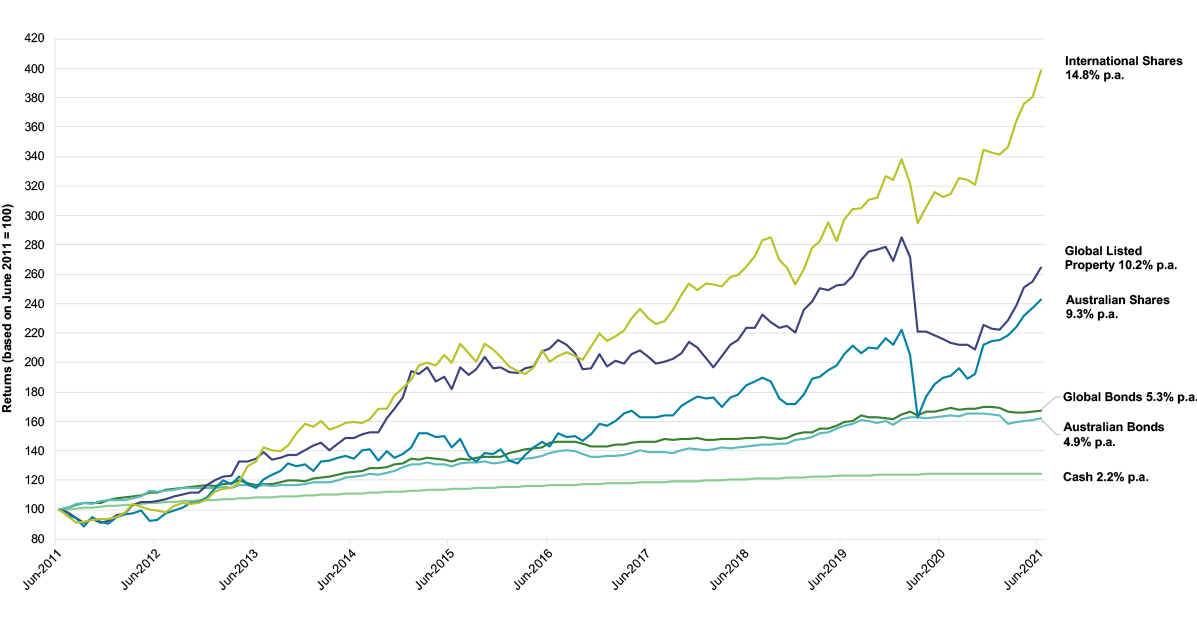
Source: Cash - Bloomberg AusBond Bank Bill Index; Global Bonds - Bloomberg Barclays Global-Aggregate Total Return Index Value Hedged AUD; Australian Bonds - Bloomberg AusBond Composite 0+ Yr Index; Global Listed Property - FTSE Custom EPRA/NAREIT Developed Index Net TRI AUD; Australian Shares - S&P/ASX Total Return 300 Index; International Shares - MSCI World ex-Australia Net Total Return AUD Index
What does this mean for your investment?
Investment returns over both the short and long term for some of our diversified plans are illustrated in the table below. You can also see the investment return history for all of our available plans.
Performance of investment options
| June 2021 quarter | 1 year | 3 years (p.a.) | 5 years (p.a.) | 10 years (p.a.) | |
|---|---|---|---|---|---|
| RI Allocated Pension Conservative plan1 | 2.42% | 8.16% | 4.86% | 4.99% | 5.71% |
| Transition to Retirement Pension Balanced plan2 | 4.16% | 15.13% | 6.84% | - | - |
| RI Allocated Pension Balanced plan1 | 4.63% | 17.33% | 7.68% | 8.08% | 8.33% |
| RI Term Allocated Pension Balanced plan1 | 4.64% | 17.34% | 7.70% | 8.11% | 8.18% |
| My West State Super3 | 4.58% | 17.34% | 7.75% | 8.08% | 8.37% |
| My GESB Super1 | 4.58% | 17.28% | 7.35% | 7.80% | 7.94% |
| West State Super Growth plan3 | 5.35% | 21.21% | 8.49% | 9.03% | 9.09% |
| Other investment plans | See the investment returns for all of our available plans | ||||
Returns greater than one year are annualised.
The financial year returns for My GESB Super and My West State Super were the highest in GESB’s history. In addition, all of GESB’s diversified plans are ahead of primary investment objectives and five and 10 year returns have been strong.
“It was pleasing to achieve such high returns for our members in the 2020/21 financial year, and particularly to bounce back from share market falls experienced in 2020 due to the COVID-19 pandemic,” said Paul Taylor, General Manager Investments.
“We are striving to achieve strong and consistent returns in the long term and are well positioned for opportunities that lay ahead.”
“It was pleasing to achieve such high returns for our members in the 2020/21 financial year and particularly to bounce back from share market falls experienced in 2020.”
- Paul Taylor, General Manager Investments
More information
- Find out more about investing with us
- Read about our approach to responsible investing
- See our super investment options or retirement investment options
- Download a PDF copy of our Investment update – 2020/21 financial year
Need help?
- Investment FAQs
- Find a personal financial adviser
- Call us on 13 43 72
1 Returns are reported net of fees and taxes.
2 Transition to Retirement Pension was incepted on 15 June 2017, so longer-term returns are not available. Returns are reported net of fees and taxes.
3 Returns are reported net of fees.
Performance information should be used as a guide only, is of a general nature, and does not constitute legal, taxation, or personal financial advice. The performance of your investment plan is not guaranteed, and returns may move up or down depending on market conditions. Past performance should not be relied on as an indication of future performance. In providing this information, we have not considered your personal circumstances including your objectives, financial situation or needs. We are not licensed to provide financial product advice. Before acting or relying on any of the information in this website, you should review your personal circumstances and assess whether the information is appropriate for you. You should read this information in conjunction with other relevant disclosure documents we have prepared and where necessary seek advice specific to your personal circumstances from a qualified financial adviser.
Thank you for printing this page. Remember to come back to gesb.wa.gov.au for the latest information as our content is updated regularly. This information is correct as at 02 August 2026.