Investment update – March 2020 quarter
Key highlights
- Global share markets dropped around 20% in the March quarter. Government enforced shutdowns, in response to the rapid spread of the COVID-19 coronavirus, caused investors to price in a deep global recession
- Many countries have cut their current growth forecasts due to the expected decline in economic activity. However, this is being partially offset with the announcement of very large government spending packages aimed at supporting businesses and reducing the financial impact of workers losing their jobs
- Defensive assets provided a buffer against a sell-off in Shares, with Cash and Bonds delivering positive returns over the March quarter
- The long-term performance remains positive for Shares despite the sharp sell-off in the March quarter. Over 10 years, International Shares has returned 6.9% per annum and Australian Shares 4.8% per annum
- My GESB Super returned -12.05% for the quarter
- My West State Super returned -11.65% for the quarter
- RI Allocated Pension Conservative plan returned -5.96% for the quarter
Investment market returns: short and medium term
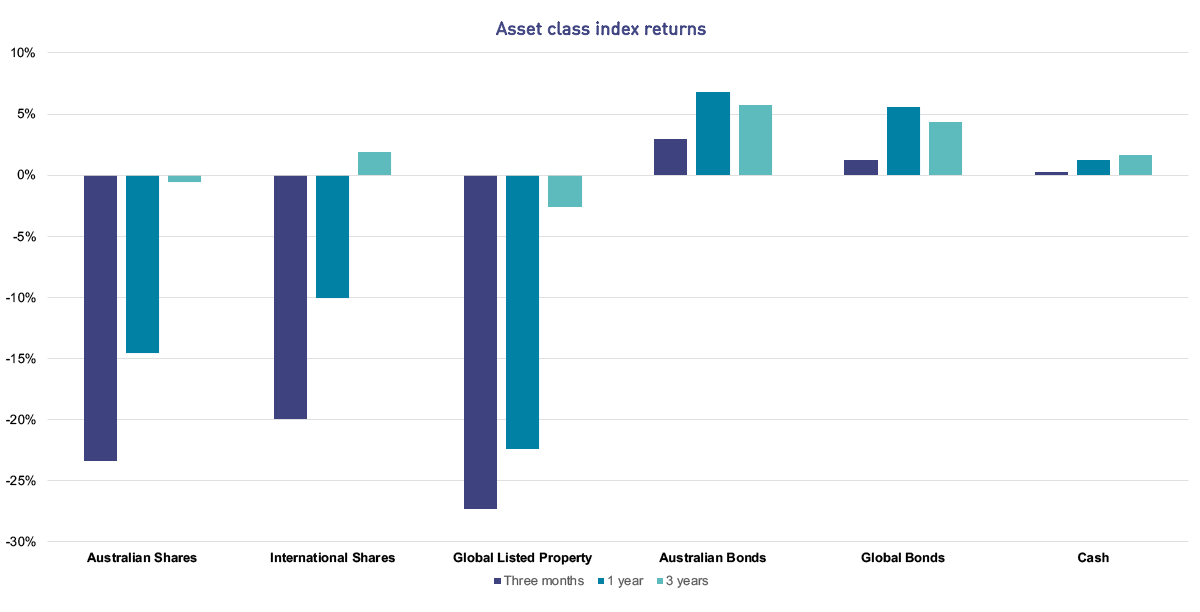
Cash and Bonds delivered positive returns for the March quarter, continuing their trend of stable and positive performance. However, the sell-off in Shares and Property has negatively impacted one and three-year returns.

Source:
Cash - Bloomberg AusBond Bank Bill Index; Global Bonds - Bloomberg Barclays Global-Aggregate Total Return Index Value Hedged AUD; Australian Bonds - Bloomberg AusBond Composite 0+ Yr Index; Global Listed Property - FTSE Custom EPRA/NAREIT Global Index Values Local TRI; Australian Shares - S&P/ASX Total Return 300 Index; International Shares - MSCI ACWI Net Total Return Local Index
What's been happening in investment markets recently?
- COVID-19 outbreak
Even though China was the epicentre for the virus outbreak in January, the latter months saw this spread across the rest of the world. Many countries enforced a partial shutdown of their economies and closed their borders to contain the spread of the virus. This has led to significant job losses and a massive disruption to all economic sectors (particularly retail, tourism and hospitality). In order to address the major economic impact, governments have announced large spending packages to mitigate the crisis deepening. - Government and central bank stimulus packages and monetary policy support
In the US, President Trump and the Senate reached an agreement on a USD$2.3 trillion (around 11% GDP) stimulus deal. Australia too announced three economic stimulus packages at the Commonwealth level, with total expenditure and revenue measures of AUD$194 billion (9.7% of GDP). The US Federal Reserve lowered its official cash rate by 1.5% to 0-0.25% while the Reserve Bank of Australia cut its official cash rate by 0.25% twice in March to 0.25%. - Oil price war between Saudi Arabia and Russia
On 8 March 2020, Saudi Arabia initiated a price war with Russia. The price war was triggered by a breakup in dialogue between the Organization of the Petroleum Exporting Countries (OPEC) and Russia over proposed oil-production cuts in the midst of coronavirus pandemic. Russia walked out of the agreement, leading to the fall of the OPEC+ alliance. Since its most recent peak of USD$74 per barrel in late 2018, the price of oil has fallen to less than USD$30 per barrel. Many countries depend on oil as a major revenue source and lower prices will hurt their economies.
What has GESB been doing in this environment?

Paul Taylor
General Manager, Investments
Paul Taylor, our General Manager, Investments, describes some of the steps our Investment team has been taking in light of what's been happening in investment markets.
'We continue to take a prudent approach to managing our investments, ensuring we balance short-term risks with long-term expected returns. During March, our exposure to shares was lower than our long-term targets but this has gradually increased and is now much closer to long-term targets. We’re currently working on re-balancing asset class exposures towards long-term targets.'
'We're also focussed on ensuring there is ample cash in the fund to meet all obligations to our members. Our cash exposure has increased over the past month, so we have more than enough to cash to meet any payments – both now and into the future.'
For the latest updates on how we're managing your super in this environment, see our article Coronavirus and the impact on super.
Investment market returns: long term
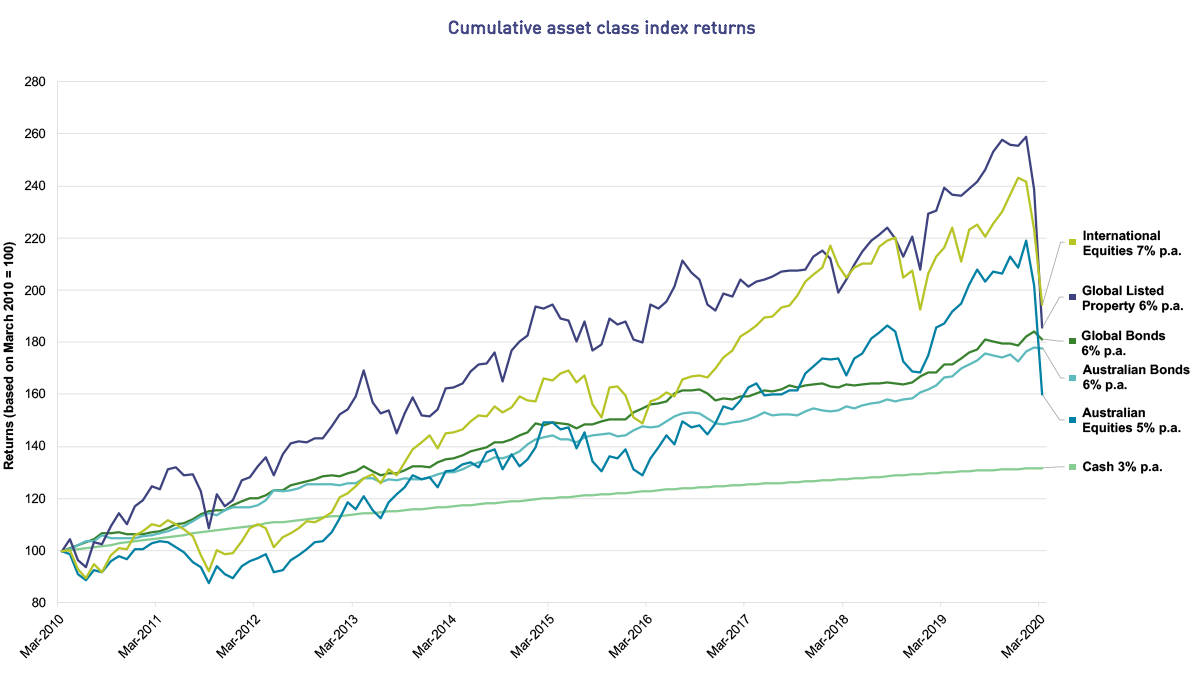
Over the longer term (10 years), investments such as Shares and Bonds have produced the highest returns (but with greater variability), while Cash has produced the lowest (but more stable) returns. This is illustrated in the chart below.

Source:
Cash - Bloomberg AusBond Bank Bill Index; Global Bonds - Bloomberg Barclays Global-Aggregate Total Return Index Value Hedged AUD; Australian Bonds - Bloomberg AusBond Composite 0+ Yr Index; Global Listed Property - FTSE Custom EPRA/NAREIT Global Index Values Local TRI; Australian Shares - S&P/ASX Total Return 300 Index; International Shares - MSCI ACWI Net Total Return Local Index
What does this mean for your investment?
The investment returns over both short and long terms for some of our diversified plans are illustrated in the table below. You can also see the investment return history for all of our available plans.
Performance of investment options
| March 2020 quarter | 1 year | 3 years (p.a) | 5 years (p.a) | 10 years (p.a) | |
|---|---|---|---|---|---|
| RI Allocated Pension Conservative plan1 | -5.96% | -1.32% | 2.80% | 3.05% | 5.18% |
| Transition to Retirement Pension Balanced plan2 | -10.83% | -4.25% | - | - | - |
| My West State Super3 | -11.65% | -4.49% | 3.03% | 3.45% | 6.64% |
| My GESB Super1 | -12.05% | -4.94% | 2.53% | 3.10% | 6.09% |
| RI Allocated Pension Balanced plan1 | -12.31% | -5.19% | 2.78% | 3.39% | 6.51% |
| RI Term Allocated Pension Balanced plan1 | -12.31% | -5.17% | 2.80% | 3.40% | 6.33% |
| West State Super Growth plan3 | -13.91% | -6.08% | 2.70% | 3.38% | 6.80% |
| Other investment plans | See the investment returns for all of our available plans | ||||
Returns greater than one year are annualised.
Though many investment plans experienced negative returns over the past year, long term returns remain in line with expectations.
While short-term performance has been negative, we are focused on delivering long-term returns that meet or exceed objectives, while remaining flexible to manage evolving investment market conditions. We follow a process to ensure well credentialed investment managers are appointed and the portfolio is positioned in a manner consistent with our investment objectives.
1 Returns are reported net of fees and taxes.
2 Transition to Retirement Pension was incepted on 15 June 2017, so longer term returns are not available. Returns are reported net of fees and taxes.
3 Returns are reported net of fees.
Performance information should be used as a guide only, is of a general nature, and does not constitute legal, taxation, or personal financial advice. The performance of your investment plan is not guaranteed and returns may move up or down depending on market conditions. Past performance should not be relied on as an indication of future performance. In providing this information, we have not taken into account your objectives, financial situation or needs. You should consider whether the information is appropriate to your objectives, financial situation, or needs before acting on it. You should consider seeking appropriate independent professional advice from a qualified advisor before making any decision with respect to your investment plan or your account. We are not licensed to provide financial product advice. You should read this information in conjunction with other relevant disclosure documents we have prepared.
More information
- Find out more about investing with us
- See our super investment options or retirement investment options
- Read our tips for investing during a market downturn
- Download a PDF printable copy of our Investment update - March 2020 quarter
Need help
- Investment FAQ's
- Find a personal financial adviser
- Call us on 13 43 72
Thank you for printing this page. Remember to come back to gesb.wa.gov.au for the latest information as our content is updated regularly. This information is correct as at 26 April 2024.